What PERC, TOPCon, HJT and back contact mean
The specifications in a module offer reflect the design of its cells. PERC, TOPCon and HJT concern how the cells reduce electrical losses. Back contact concerns the position of the electrical contacts, so these categories overlap.
PERC, short for passivated emitter and rear cell, adds a rear passivation coating to reduce recombination. Recombination occurs when electrons recombine with holes, their positive counterparts, reducing the charge available for collection. Small openings through the coating connect the silicon to the rear metal contact.
TOPCon, or tunnel oxide passivated contact, addresses losses through a contact structure combining an ultrathin oxide film with doped polysilicon. This structure reduces recombination while permitting charge collection.
HJT, or heterojunction technology, combines a crystalline silicon wafer with thin amorphous silicon layers. These layers passivate the wafer surfaces, reducing electrical losses at surface defects.
Back contact places both positive and negative electrical contacts on the rear, leaving the front free of metal grid shading. Several designs follow this arrangement, including variants incorporating heterojunction contacts.
For the finished panel, compare module efficiency, the percentage of incident sunlight power converted to electrical power across its total area. Cell efficiency concerns the cell alone. The module figure also accounts for inactive spaces and assembly losses.
| Technology | Module efficiency | Pmax temperature coefficient | Bifaciality factor | Warranty allowance: first year / subsequent years | Maturity and cost |
|---|---|---|---|---|---|
| PERC | 20.9–21.7% | Around −0.35%/°C | 70 ±5% | ≤2% / 0.45% annually | Outdated technology |
| TOPCon | Up to 24.8% | −0.26%/°C | 85 ±5% | ≤1% / 0.35% annually | Mainstream; obtain project quote |
| HJT | Up to 23.5% | −0.24%/°C | Up to 95% | ≤1% / 0.3% annually | Commercial; obtain project quote |
| Back contact | Up to 25% | −0.26%/°C | 70–75% nominal | ≤1% / 0.35% annually | Commercial; obtain project quote |
Selected commercial examples from LONGi, JinkoSolar, Huasun and AIKO. Figures vary by product and generation. The back-contact bifaciality range covers nominal values of 70% for AIKO STELLAR 2N+78 and 75% for LONGi Hi-MO 9, both quoted with ±5% tolerance. Warranty allowances differ from measured field degradation.
Module efficiency determines the capacity fitting within a given area. The site’s solar resource and operating conditions determine its annual energy yield.
SolarBrief recommends TOPCon and back-contact modules for new projects.
How heat affects module output
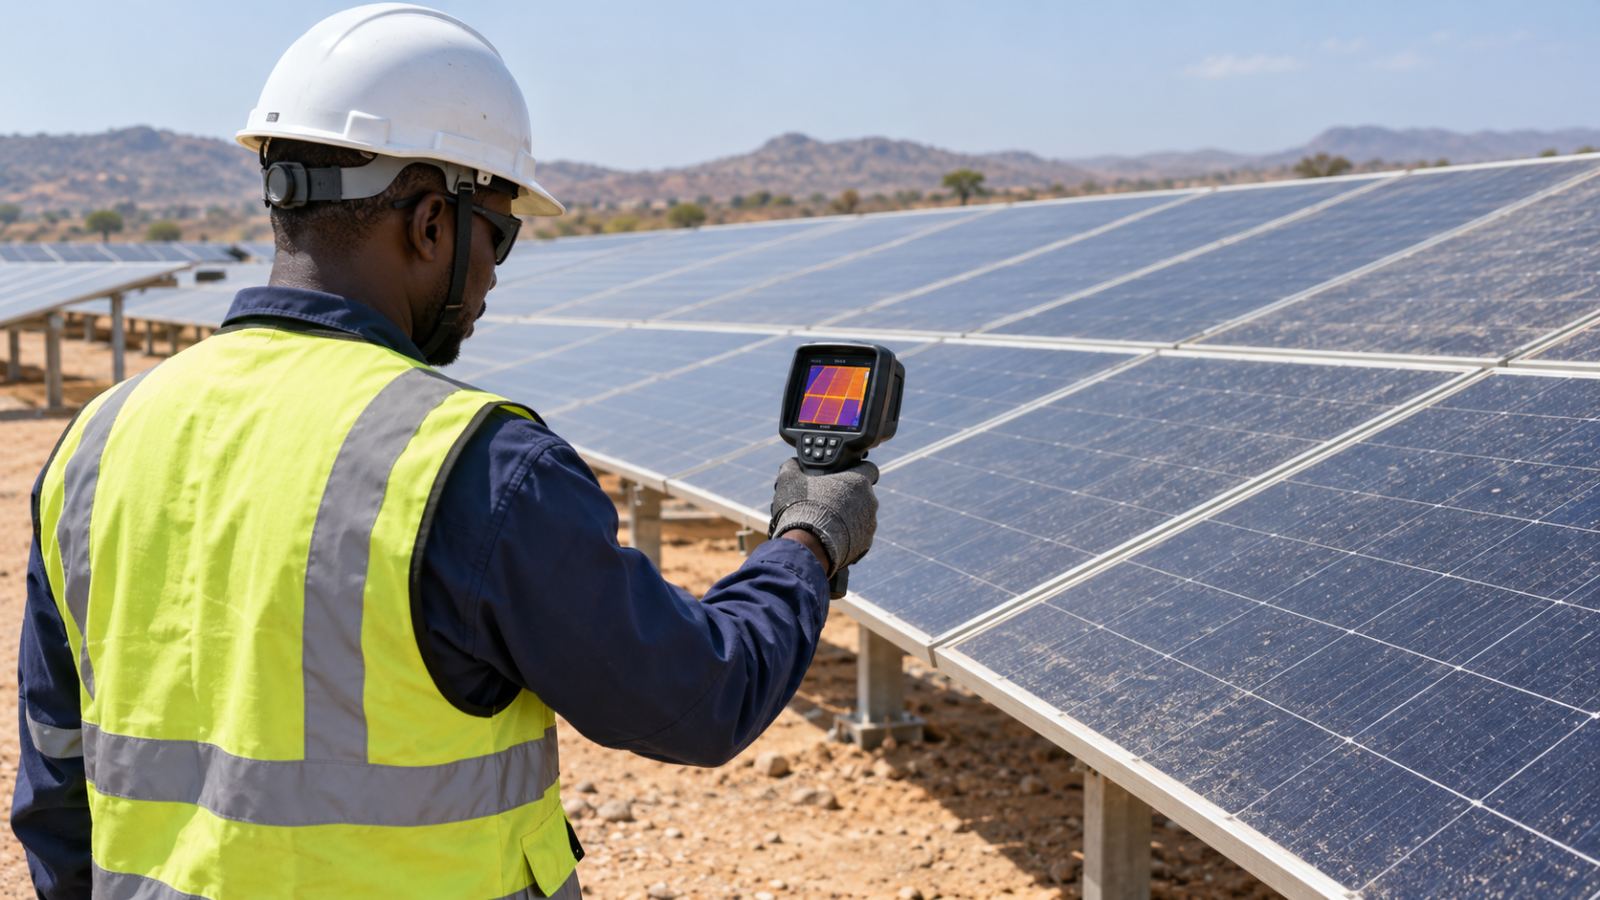
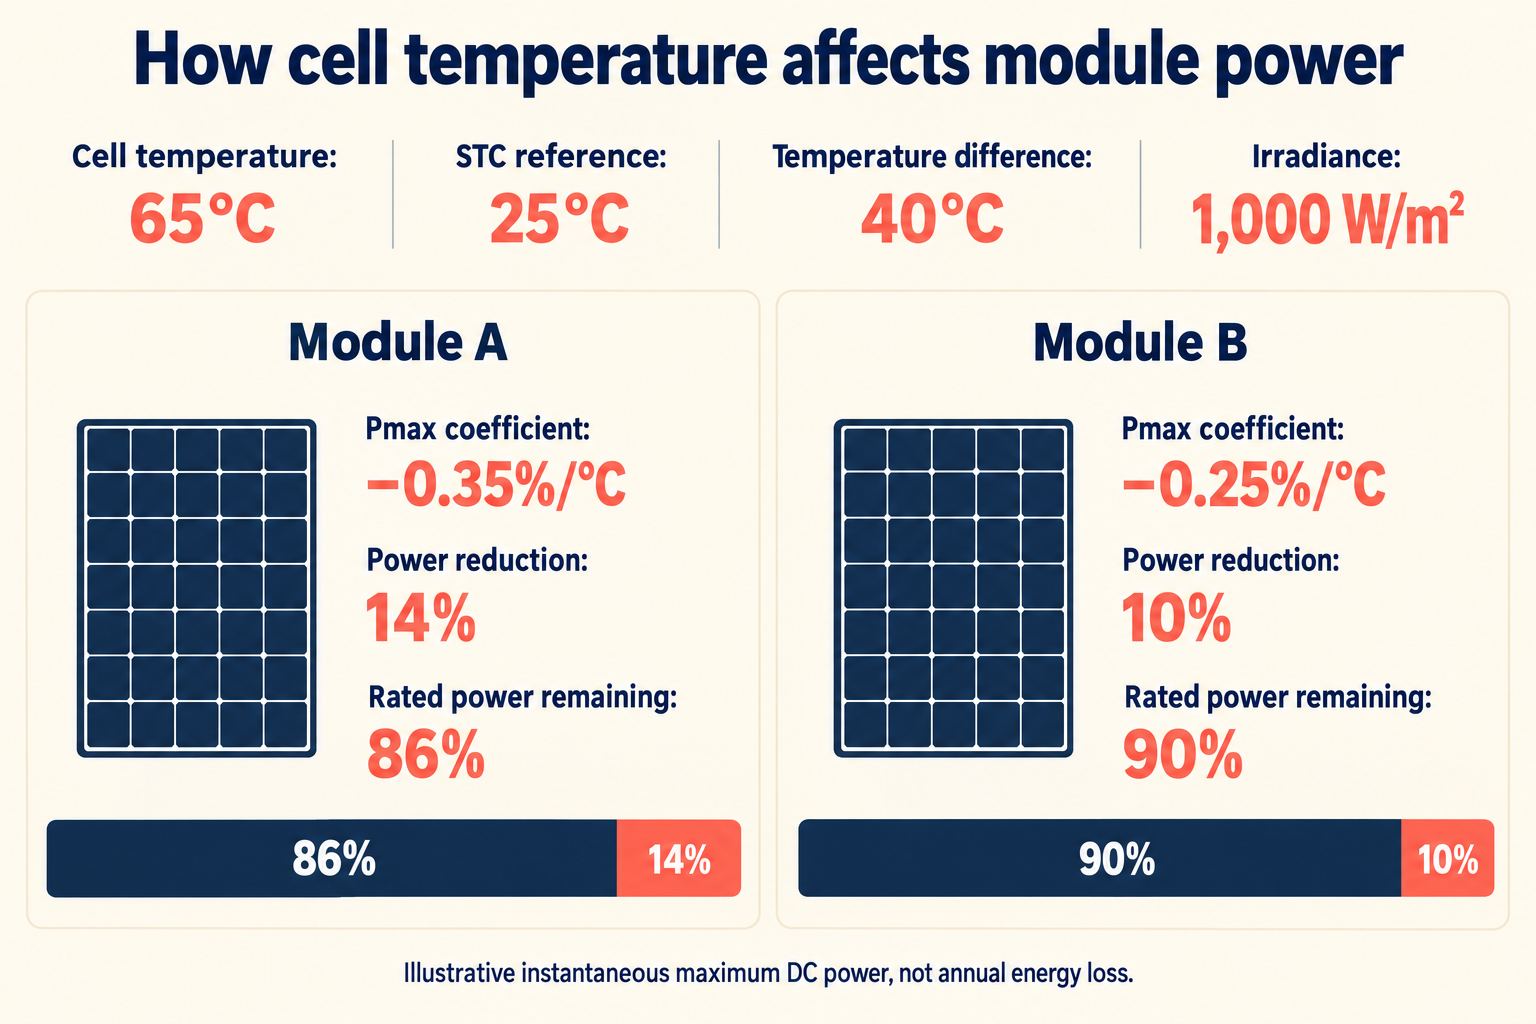
As silicon cells heat up, their voltage falls more than their current rises, reducing maximum power. The datasheet’s Pmax temperature coefficient expresses this response. A value of −0.35%/°C means an approximate loss of 0.35% of rated power per degree above the 25°C cell-temperature reference, with irradiance held constant.
Cell temperature differs from the air temperature in a weather report. Under strong sunlight, a rise of 25–35°C above ambient is plausible, depending on wind and mounting conditions. Restricted airflow beneath close-mounted rooftop modules increases operating temperature compared with a well-ventilated array under equivalent weather conditions.
LONGi reports a field test in which its Hi-MO 9 back-contact modules averaged 1.26°C below the tested TOPCon modules at the rear surface. This supports reduced operating temperature for those products under the test conditions.
For an illustrative Sahel example, assume cells reach 65°C, or 40°C above the standard test conditions (STC) reference. At 1,000 W/m² irradiance:
| Pmax temperature coefficient | Approximate reduction in maximum DC power |
|---|---|
| −0.35%/°C | 0.35% × 40 = 14% |
| −0.25%/°C | 0.25% × 40 = 10% |
These are instantaneous power reductions. Annual energy losses depend on temperatures across operating hours.
In the Sahel, assess heat performance alongside dust exposure. A humid coast adds moisture and salt-exposure requirements. Equatorial highland sites need local temperature data to assess the benefit of a less negative coefficient. Off-grid and mobile describe applications, so assess their operating climate alongside mounting and ventilation.
Modules with temperature coefficients of −0.35%/°C and −0.25%/°C retain approximately 86% and 90% of rated power at 65°C.
PVGIS already models temperature effects. A separate heat deduction would duplicate those losses, as explained in an earlier article on Performance Ratio and system losses. Product comparisons need modelling reflecting the proposed modules’ characteristics.
Glass-glass or glass-backsheet: assessing module construction
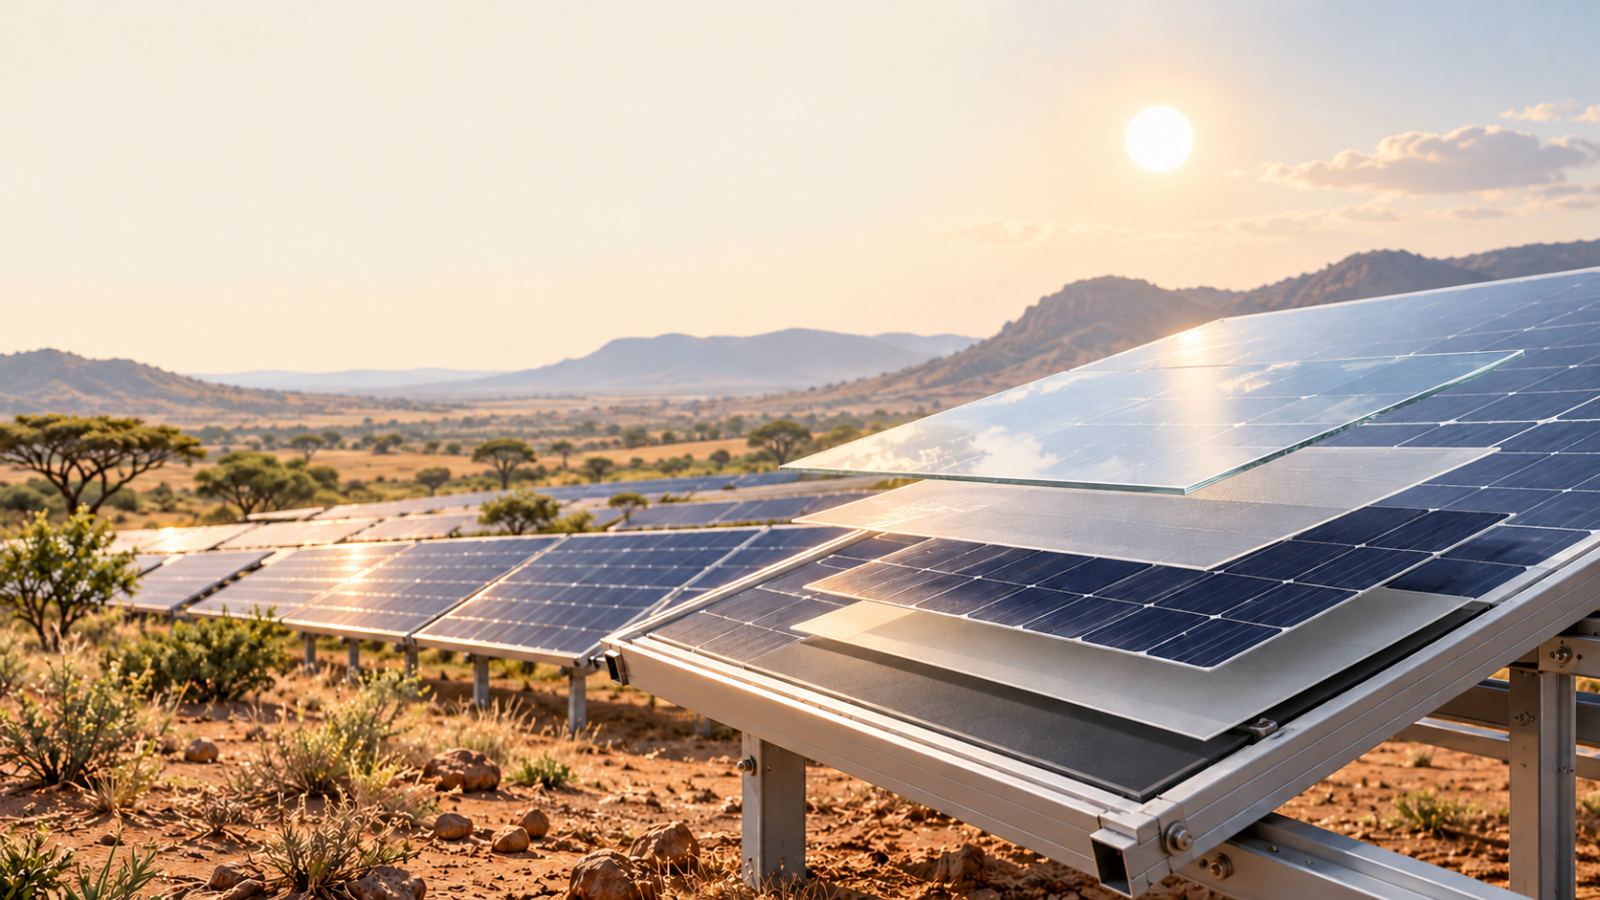
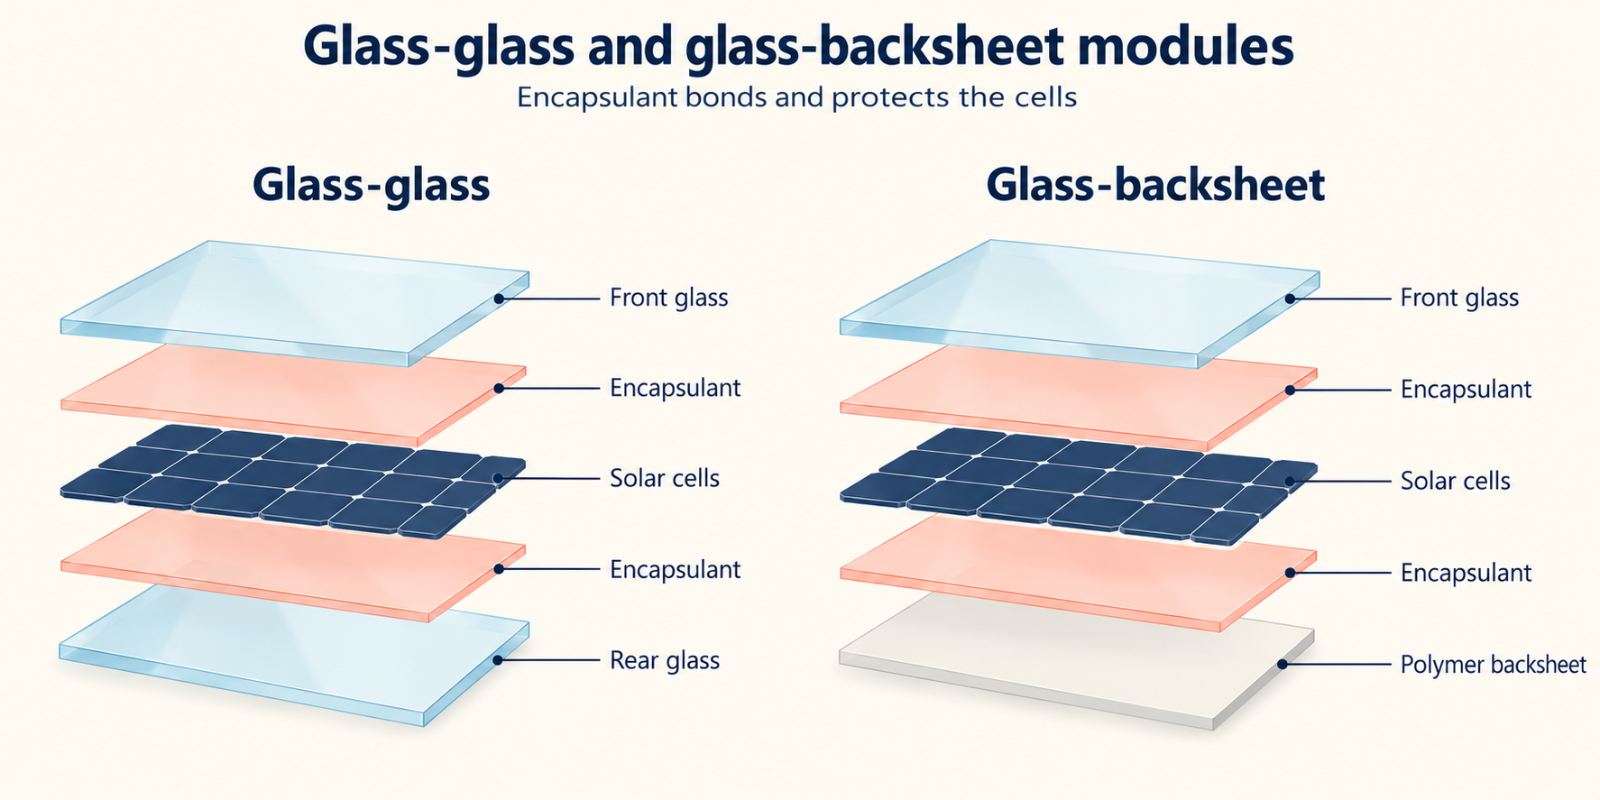
The cells inside a solar module need protection from moisture and mechanical stress. An encapsulant, a transparent polymer surrounding the cells, bonds them to the outer protective layers and helps insulate the electrical circuit. Both constructions have front glass. Glass-glass modules add rear glass; glass-backsheet modules have a polymer rear sheet.
Exploded module diagrams identifying front glass, encapsulant on both sides of the cells, and rear glass or a polymer backsheet.## When bifacial modules add useful energy
Bifacial solar panels generate electricity from light reaching either face. On a datasheet, the power bifaciality factor compares rear-side maximum power with front-side maximum power, measured separately under identical test conditions.
An 80% factor means the rear produces 80% of the front’s power under equal illumination. To estimate its contribution on site, we also have to account for the light reaching it.
With 1,000 W/m² at the front and 300 W/m² at the rear, the rear receives 30% as much irradiance. For a 500 W module with 80% power bifaciality, the approximate additional power is:
500 W × 0.80 × 0.30 = 120 W
This brings estimated output to 620 W, or 24% above the front-side rating. The example assumes a cell temperature of 25°C and uniform illumination on each face, with additional system losses excluded.
A tolerance beside the bifaciality figure adds another consideration. If 80% ±10% means ±10 percentage points, the factor spans 70–90%. At the illustrative 30% rear irradiance ratio, this corresponds to approximately 21–27% additional power. A relative ±10% tolerance instead spans 72–88%, so the datasheet’s definition governs the calculation.
On site, ground reflectivity, called albedo, influences rear illumination. Pale sand generally reflects more sunlight than vegetation. Mounting height and row spacing affect how much illuminated ground the rear faces see, while close-mounted roofs restrict rear exposure.
Annual energy gain depends on these conditions throughout the year. An IEA PVPS report records gains of 7–14% at Chile’s ATAMOSTEC desert site, depending on technology and mounting arrangement. For a Sahel installation, the estimate must reflect local rear illumination and the proposed layout.
How degradation and warranties affect lifetime yield
Solar panel degradation includes an initial reduction in output and a subsequent annual decline. These require separate yield assumptions because early performance varies by module type.
LID, light-induced degradation, develops when sunlight activates defects within cells. LeTID, light and elevated temperature-induced degradation, involves light exposure at elevated temperatures and sometimes develops beyond year one. Susceptibility depends on cell materials and processing. Initial degradation varies by cell design and manufacturing process, so a blanket 1% LID deduction is inappropriate.
A product warranty covers specified defects in materials and manufacture. A performance warranty sets the minimum power a module should retain over time. Its first-year reduction and subsequent annual allowance establish the guaranteed output at year 25 or 30.
For example, a 500 W module with a maximum 1% first-year reduction retains at least 495 W after year one. An annual allowance of 0.4% of original rated power then permits a 2 W reduction per year. Years 2–25 contain 24 deductions, totalling 48 W:
500 W − 5 W − (24 × 2 W) = 447 W
The year-25 guarantee is therefore 89.4% of rated power, subject to the warranty’s test conditions.
The module warranty documents also specify the evidence and testing required for a claim, including responsibility for removal or transport costs.
Matching the module to the project’s conditions
The preceding comparisons help you assess a module against its intended installation. Local climate guides the performance assessment, while the application adds electrical and handling requirements.
| Project setting | What to examine |
|---|---|
| Sahel | Compare Pmax temperature coefficients alongside dust exposure and cleaning requirements, with IEC 60068 as a reference for environmental testing. Calculate bifacial gain from local ground reflectivity and the proposed layout. |
| Humid coast | Request damp-heat results for the proposed construction. For salt-exposed sites, examine salt-mist corrosion test results under IEC 61701. |
| Equatorial highlands | Calculate yield using local temperature and irradiance data. Assess whether the proposed technology’s heat performance warrants its price premium. |
| Off-grid installation | Assess lifetime yield and access to replacement modules. Confirm string voltage and current remain within the charge controller’s limits under expected temperature extremes. |
| Mobile installation | Compare module mass and mounting instructions. Examine vibration-test evidence relevant to the application, alongside transport and handling requirements. |
Request test documentation for the quoted model and construction. Compare delivered prices through Deal Board Live, if relevant listings are available. Assess any premium against the projected energy benefit and installation costs.
Applying the comparison in the Project Builder
In the Project Builder, System losses combines operational losses such as soiling and wiring. The separate Module losses setting accounts for declining output as modules age, with a 0.45% annual default, adjustable from 0.2–0.8%.
Field evidence relevant to the selected module and climate helps assess this annual assumption. Warranty allowances establish contractual protection; their permitted reductions differ from expected degradation in service.
The tool excludes initial LID, described in its guidance as approximately 1% in year one. This is the tool’s stated assumption; the initial loss varies by product and is distinct from recurring annual degradation.
Our article on Performance Ratio and system losses discusses the loss breakdown. The Project Builder’s guidance confirms PVGIS already includes temperature effects, so an additional heat deduction would duplicate losses.
For the selected module, compare its degradation evidence with the Module losses setting and document the initial-LID exclusion alongside the yield estimate.
What it means
Equal solar capacity can produce different lifetime energy yields. Compare module heat performance and degradation alongside construction suited to the site. Bifacial gains depend on rear illumination, while warranty figures define guaranteed output over time.
Sources: Fraunhofer ISE, Photovoltaics Report, NREL, PV Lifetime Project, 2024 Annual Report, Kiwa PVEL, PV Module Reliability Scorecard, LONGi, manufacturer website, Huasun, manufacturer website