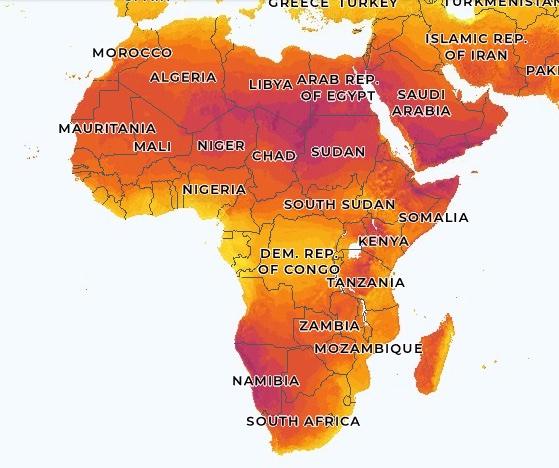
Nameplate capacity is the rated output under test conditions. Sunlight and operating conditions vary by site, so annual production varies too. According to the International Energy Agency, Africa is home to 60% of the world's best solar resources. Project teams still need an estimate for their chosen coordinates.
SolarBrief Africa's Project Builder calculates this estimate with the Photovoltaic Geographical Information System (PVGIS). This article explains how irradiance and Peak Sun Hours lead to annual solar energy yield. A worked example follows the calculation from map coordinates to kWh/kWp per year, followed by a glossary of the main indicators.
From Sunlight to Numbers
Suppose 900 watts of solar power reaches one square metre of surface at noon. The irradiance at this moment is 900 W/m².
Irradiance = Solar power ÷ Surface area
900 W ÷ 1 m² = 900 W/m²
As the sun crosses the sky, the reading rises towards noon and falls through the afternoon. Irradiation adds this varying power over a stated period and reports the energy received.
Suppose the irradiance measurements recorded across ten hours produce an average of 500 W/m², or 0.5 kW/m²:
Irradiation = Average irradiance × Time
0.5 kW/m² × 10 hours = 5 kWh/m²
Each square metre receives 5 kWh of solar energy during this period. Irradiance measures power at a given moment. Irradiation measures the energy accumulated over time.
On a horizontal surface, sunlight arrives as a direct beam and diffuse light from the sky. Global horizontal irradiance (GHI) combines both components.
GHI = DNI × cos(θz) + DHI
In this equation, θz is the angle between the sun's rays and a vertical line above the site. A small angle means the sun is high in the sky.
Direct normal irradiance (DNI) records the direct beam on a surface held perpendicular to the sun's rays. Diffuse horizontal irradiance (DHI) records scattered sky light on a horizontal surface.
With DNI at 800 W/m², DHI at 120 W/m² and a 30° zenith angle:
GHI = 800 × cos(30°) + 120 = 813 W/m²
These figures are momentary irradiance values. Daily and annual totals appear in irradiation units such as kWh/m². These definitions come from the Global Solar Atlas and the PVGIS documentation.
GHI records the resource on a flat surface. A fixed PV array holds modules at a selected tilt, so PVGIS calculates plane-of-array irradiation for this angle.
Kilowatt-peak (kWp) states the array's rated DC power under Standard Test Conditions (STC): 1,000 W/m² irradiance and a cell temperature of 25°C.
20 modules × 500 Wp = 10,000 Wp = 10 kWp
The PVGIS manual defines kWp as the array rating. Annual output also depends on the solar resource and PV system losses.
Peak Sun Hours: A Simpler Way to Read the Resource
A day of sunlight includes low morning irradiance, a strong period around noon and a decline towards sunset. Peak Sun Hours (PSH) express this uneven profile as an equivalent number of hours at a steady 1,000 W/m².
Peak Sun Hours = Daily irradiation (kWh/m²/day) ÷ 1 kW/m²
A site receiving 5.5 kWh/m² in one day has:
5.5 kWh/m²/day ÷ 1 kW/m² = 5.5 PSH/day
It has 5.5 PSH, even if daylight lasts twelve hours. Daylight hours measure time from sunrise to sunset. PSH measures the solar energy received during this time.
Peak sun hours across Africa also vary by month. Wet and dry seasons may cause large swings in expected output. PVGIS lists monthly irradiation totals, and NASA POWER supplies daily and hourly series for the same coordinates.
For a yield estimate, use irradiation on the proposed module plane because it reflects the energy reaching the tilted modules.
From Irradiation to Annual Solar Yield
Specific yield is the annual AC energy produced for each installed kWp of DC capacity. Its unit is kWh/kWp/year.
Specific yield = Annual AC energy ÷ Installed DC capacity
Dividing annual output by installed capacity places projects of different sizes on a common basis. Consider a 50 kWp array producing 80,000 kWh per year and a 100 kWp array producing 150,000 kWh:
80,000 kWh ÷ 50 kWp = 1,600 kWh/kWp/year
150,000 kWh ÷ 100 kWp = 1,500 kWh/kWp/year
The 100 kWp array produces more electricity in total. Each installed kWp in the 50 kWp array, however, produces 100 kWh more during the year. Specific yield qualifies the site and the system design, not the size of the cheque.
A simplified estimate starts with average daily PSH on the proposed module plane. Plane-of-array PSH includes the effect of module tilt on the solar energy reaching the modules.
Annual specific yield ≈ Average daily plane-of-array PSH × 365 × Performance Ratio
The performance ratio (PR) accounts for losses between theoretical production and AC output. A PR of 0.80 means the system delivers 80% of its ideal output. Cell temperature, soiling, cabling, inverter conversion and downtime all reduce the final figure.
Assume average daily plane-of-array PSH of 5.5 and a PR of 0.80:
5.5 × 365 × 0.80 = 1,606 kWh/kWp/year
For a 100 kWp system, multiply the specific yield by installed capacity:
1,606 kWh/kWp/year × 100 kWp = 160,600 kWh/year
The estimated annual AC production is 160,600 kWh. PVGIS applies a detailed hourly model based on in-plane irradiation and module temperature, along with the selected system losses, rather than a single performance ratio.
Why African Sites Produce Different Yields
Installed capacity tells us how large a PV system is. Location determines how much solar energy reaches its modules, placing African specific yield within a broad screening range of about 1,400 to 2,000 kWh/kWp/year.
A PVGIS comparison across three cities places this range in context:
| Site | Array tilt | Annual yield | Peak month |
|---|---|---|---|
| Dakar | 15° | 1,832 kWh/kWp | March |
| Nairobi | 10° | 1,490 kWh/kWp | March |
| Windhoek | 23° | 1,888 kWh/kWp | August |
Each run uses 1 kWp of crystalline-silicon capacity, free-standing mounting and 14% system losses. These values support site screening rather than a production guarantee.
Cloud cover weakens the direct solar beam during wet seasons in coastal and equatorial regions. Across hot inland areas, high cell temperatures reduce module efficiency even under strong irradiation. Sahel projects face added dust exposure, so their loss studies should reflect local soil conditions and the proposed cleaning schedule. At Nairobi's highland elevation, cool air supports module performance. Seasonal cloud and rainfall still reduce its annual output.
A hill east of an array may delay morning exposure, while a building west of it may cut late-afternoon production. PVGIS incorporates terrain-horizon data, and the selected module tilt determines how much irradiation reaches the array plane.
Only 56 kWh/kWp/year separates the Dakar and Windhoek totals. Their production peaks occur five months apart: March in Dakar and August in Windhoek. EPCs and energy buyers assessing seasonal demand or storage should examine output month by month. The Global Solar Atlas maps GHI and PVOUT across Africa for broader site comparisons.
Worked Example: From a Map Point to Annual Production
The formulas above describe the chain of calculation. This section follows the process from start to finish using the Dakar coordinates from the comparison table.
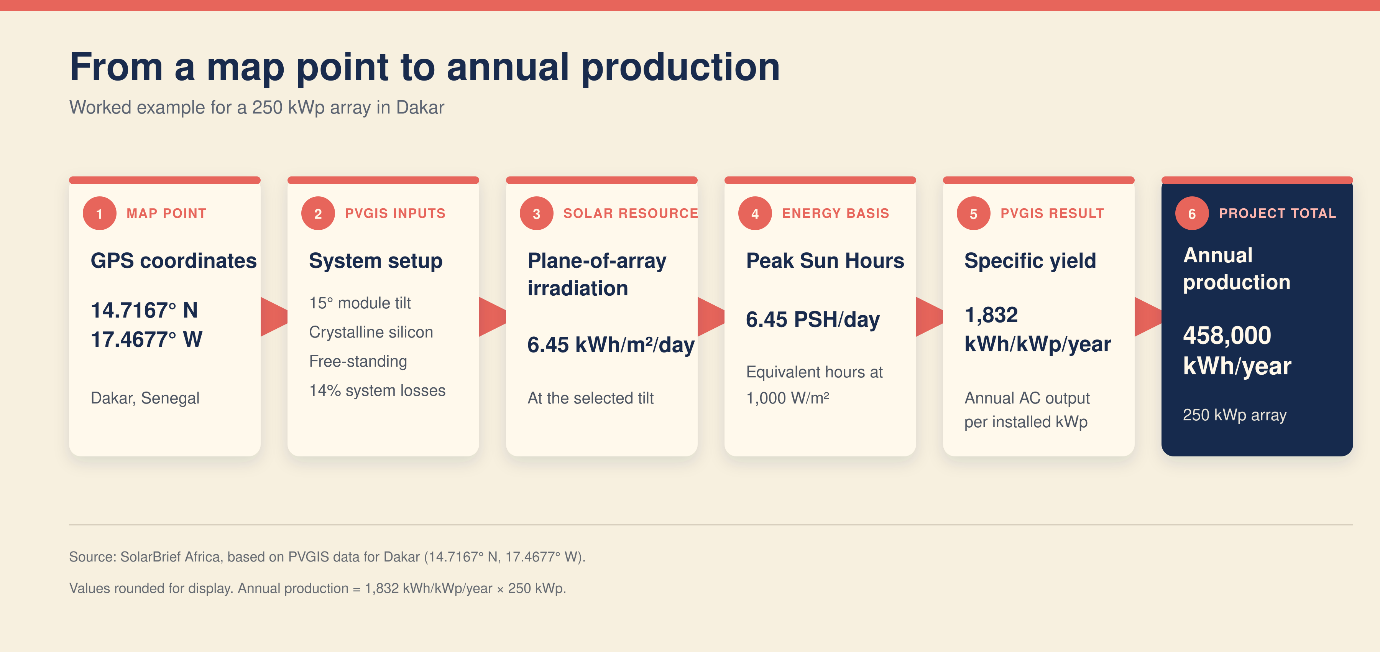
The proposed site is located at 14.7167° N, 17.4677° W. The SolarBrief Project Builder reads these coordinates when you place the project point on the map.
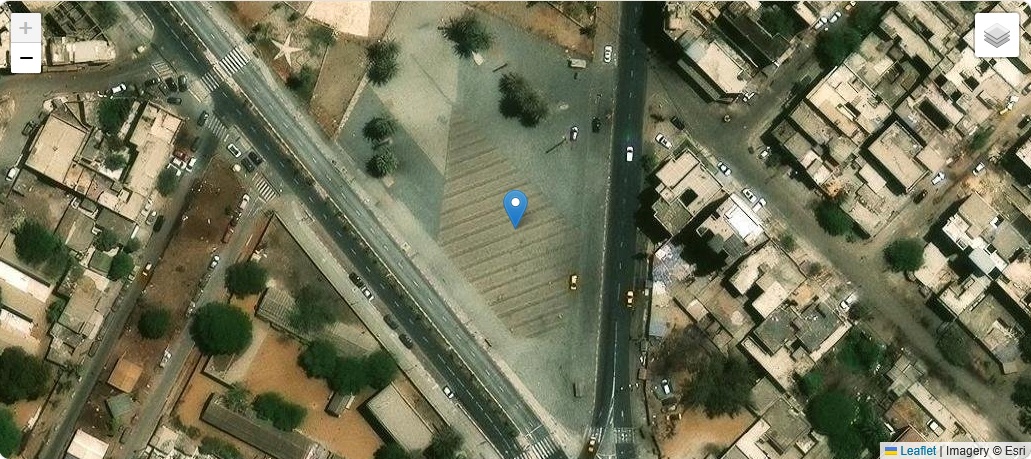
For this example, select crystalline-silicon modules, free-standing mounting and a 15° tilt, then select "Calculer le productible (PVGIS)".
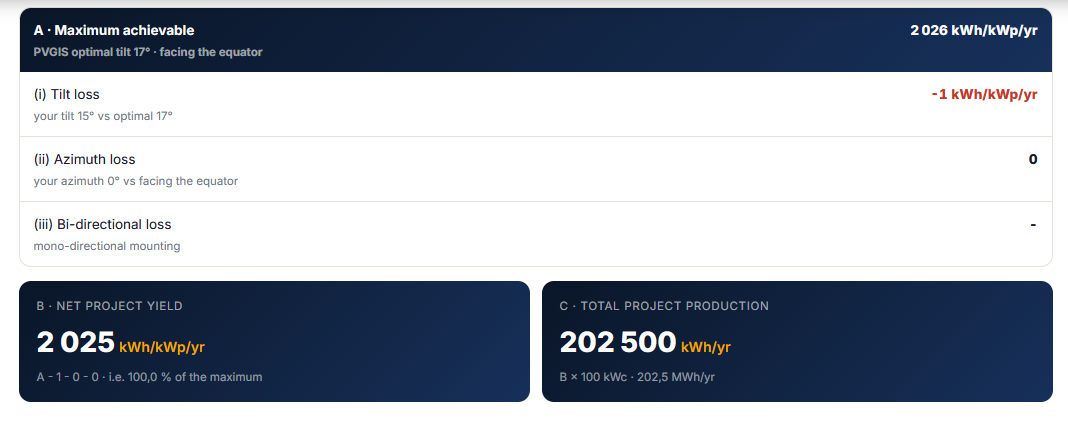
Read the loss setting before reading the result. The Project Builder opens with its own default system losses of 3.5%, which is why the screen above returns 2,025 kWh/kWp/year for this site. The comparison table earlier in this article applies the PVGIS default of 14%, which returns 1,832 kWh/kWp/year at the same coordinates. Nothing else changed between the two figures. The loss assumption is the single input that moves a yield estimate the most, and it is the first thing to agree on with an EPC.
The rest of this example keeps the 14% setting, so that its result can be compared with the table.
PVGIS matches the coordinates with its solar and weather datasets. It accounts for the local terrain horizon, then calculates the irradiation reaching the modules at the selected tilt. For these inputs, the PVGIS calculation returns average plane-of-array irradiation of 6.45 kWh/m²/day:
6.45 kWh/m²/day ÷ 1 kW/m² = 6.45 PSH/day
PVGIS then models module performance through the year. The calculation includes temperature and irradiance effects, incidence-angle losses and the 14% system-loss setting. Together, these factors produce a total modelled loss of 22.14%, equivalent to an annual performance ratio of about 0.779.
The simplified yield formula now reaches the PVGIS result:
6.45 PSH/day × 365 × 0.779 ≈ 1,832 kWh/kWp/year
A 250 kWp array at this location would produce an estimated:
1,832 kWh/kWp/year × 250 kWp = 458,000 kWh/year
This estimate reflects the selected location and system inputs. A different map point, tilt or loss setting will produce another result.
Where the Resource Data Comes From
A solar-resource value on a map comes from years of satellite observations, weather records and mathematical modelling. The source behind the figure affects how a project team should read it.
| Platform | Data provided | Main role |
|---|---|---|
| PVGIS | Long-term satellite and reanalysis data combined with PV performance models | Estimates irradiation and PV energy output |
| Global Solar Atlas | High-resolution solar-resource and PV-potential maps developed from Solargis data | Compares locations through GHI, DNI and PVOUT |
| NASA POWER | Solar observations from satellites plus meteorological data from assimilation models | Supplies hourly, daily and annual time series |
PVGIS and Global Solar Atlas may estimate different values for one coordinate because they draw from separate datasets, cover different reference periods and process the resource at different grid resolutions.
An annual average therefore blends several weather years. The selected period may include more cloudy seasons or more sunny ones, affecting the result returned by each platform. Production in any single year may fall below the long-term estimate or exceed it. The PVGIS manual reports this year-to-year variability as the standard deviation across the selected solar database.
Glossary: Key Terms and Their Calculations
A quick recap of every term used above, in the order they appear, with the formula behind each one.
| Term | What it means | How it is calculated |
|---|---|---|
| Irradiance (W/m²) | Instantaneous solar power reaching one square metre of surface. | Irradiance = Solar power ÷ Surface area |
| Irradiation (kWh/m²) | Solar energy accumulated over a stated period (a day, a year). | Irradiation = Average irradiance × Time |
| Global Horizontal Irradiance, GHI (W/m²) | Total instantaneous irradiance on a horizontal surface: direct beam plus diffuse sky light. | GHI = DNI × cos(θz) + DHI |
| Direct Normal Irradiance, DNI (W/m²) | The direct beam measured on a surface held perpendicular to the sun's rays. | Measured or modelled directly, not derived |
| Diffuse Horizontal Irradiance, DHI (W/m²) | Scattered sky light measured on a horizontal surface. | Measured or modelled directly, not derived |
| Plane-of-array irradiation | Irradiation received on the tilted plane of the modules, once tilt and orientation are applied. | Modelled by PVGIS from GHI, DNI, DHI and the selected tilt and aspect |
| Kilowatt-peak, kWp | An array's rated DC power under Standard Test Conditions (1,000 W/m², 25°C cell temperature). | kWp = (Number of modules × Wp per module) ÷ 1,000 |
| Peak Sun Hours, PSH (h/day) | The uneven daily irradiance profile expressed as an equivalent number of hours at the 1,000 W/m² reference. | PSH = Daily irradiation (kWh/m²/day) ÷ 1 kW/m² |
| Performance Ratio, PR | The share of theoretical DC output that reaches the grid as AC energy, after temperature, soiling and inverter losses. | PR = 1 − System losses (e.g. 14% loss gives PR = 0.86) |
| Specific yield (kWh/kWp/year) | Annual AC energy produced per installed kWp of DC capacity, the figure that lets projects of any size be compared. | Specific yield = Annual AC energy ÷ Installed DC capacity, ≈ Average daily plane-of-array PSH × 365 × PR |
What it means
Two figures decide a yield estimate: the solar resource on the module plane, and the loss assumption. The first is read from PVGIS for the exact coordinates. The second is a choice, and moving it from 3.5% to 14% takes the same Dakar site from 2,025 to 1,832 kWh/kWp/year. Agree on it before comparing any two offers.
Sources: International Energy Agency, Africa Energy Outlook 2022, EU Joint Research Centre, PVGIS 5 User Manual, EU Joint Research Centre, PVGIS Data Sources and Calculation Methods, Global Solar Atlas, Solar-resource definitions, Global Solar Atlas, Methodology, Global Solar Atlas, Map, NASA POWER, Data Access Viewer, NASA POWER, Methodology