Key takeaways
Tilt measures the angle between the module surface and a horizontal plane. A flat module has a tilt of 0°.
Azimuth identifies the compass direction faced by the modules.
North of the equator, fixed arrays usually face south. South of the equator, they face north.
East-west layouts spread production between morning and afternoon, reducing the sharp midday peak.
PVGIS identifies the fixed tilt and orientation expected to maximise annual energy. Roof shape, land limits and electricity demand might favour another arrangement.
Azimuth And Tilt: The Two Angles Controlling Solar Capture
A fixed solar module has two positioning angles. Tilt measures the slope between its surface and a horizontal plane. A module at 0° lies flat, while one at 90° stands vertical. The selected tilt affects how the surface receives sunlight as solar elevation varies through the year.
Azimuth identifies the direction faced by the module. An east-facing array receives more direct sunlight during the morning. A west-facing array favours the afternoon. South-facing or north-facing modules concentrate more production around midday.
Together, both angles determine plane-of-array irradiation, the solar energy reaching the module surface.
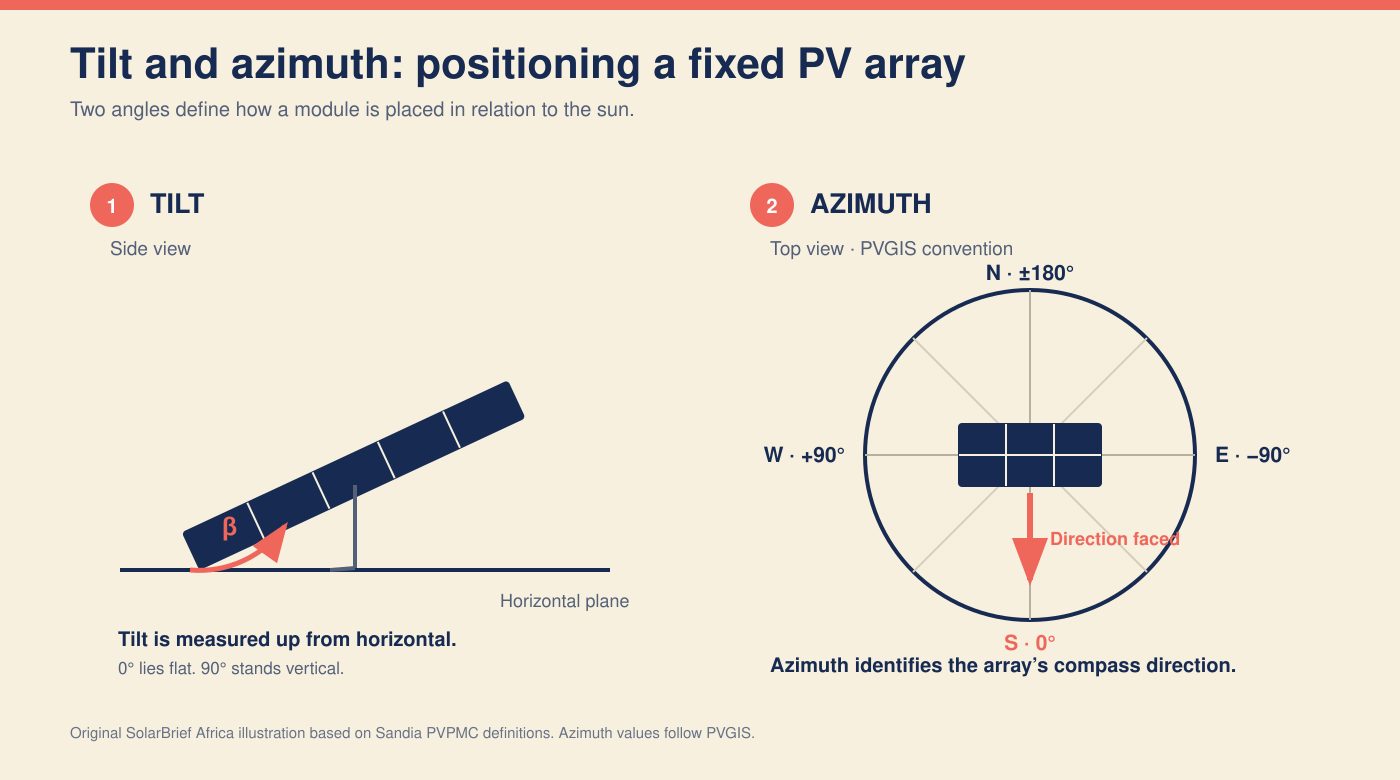
Azimuth values differ between modelling tools. Sandia follows a compass convention measured clockwise from north. SolarBrief’s Project Builder follows the PVGIS convention, measured from south. All manual azimuth values in this article follow PVGIS.
| Direction | Sandia convention | PVGIS convention |
|---|---|---|
| North | 0° | ±180° |
| East | 90° | −90° |
| South | 180° | 0° |
| West | 270° | +90° |
The Latitude Rule Of Thumb
Latitude is a first estimate for fixed-array tilt. The optimal tilt by latitude rule takes the absolute value, so sites at 15° N and 15° S start near 15°. PVGIS tests the coordinate for the angle linked to the highest annual yield.
Local weather explains departures from this estimate. Cloud cover raises the share of diffuse light, while horizon shading blocks sunlight at some solar elevations. Production season also influences the choice: a steeper array favours low-sun months; a shallow array favours periods with a high sun.
As latitude approaches zero, the annual optimum falls to a low angle. Designers retain about 10° as a self-cleaning angle, helping rainwater drain and carry dirt from the glass. This figure remains a guideline because rain intensity, dust type, module frames and maintenance practices affect cleaning. Sandia notes some deposits wash away with rain, while others require manual cleaning.
Africa Spans Both Hemispheres
Equator-facing means two directions in Africa. Modules in Tunis, north of the equator, face south. In Cape Town, south of the equator, they face north. Both direct the module plane towards the sun’s dominant annual path.
Nairobi requires a finer choice. The city lies 1.3° south of the equator, and the midday sun passes to its north and south during different seasons. A steep equator-facing array would favour one part of this annual path. Low tilt reduces the energy penalty as the sun crosses to the other side.
These hemisphere rules guide solar orientation in Africa, although near-equatorial coordinates deserve a PVGIS calculation. For equator-facing solar panels, the Project Builder selects south above the equator and north below it.
East-West Solar: A Different Production Shape
An east-west solar layout divides the array between two module planes. The east-facing plane produces more during the morning; the west-facing plane takes over during the afternoon. Combined output spreads generation through more of the day and lowers the noon peak.
A Cape Town PVGIS comparison uses 1 kWp of crystalline-silicon capacity, a 30° tilt and 14% system losses for both arrangements.
| Layout | Annual specific yield | Difference |
|---|---|---|
| North-facing | 1,728 kWh/kWp/year | Reference |
| 50% east, 50% west | 1,444 kWh/kWp/year | −284 kWh/kWp/year (−16.4%) |
The east-facing half leads in the morning, while the west-facing half leads later in the day. At noon, neither plane points towards the sun as directly as the north-facing array.
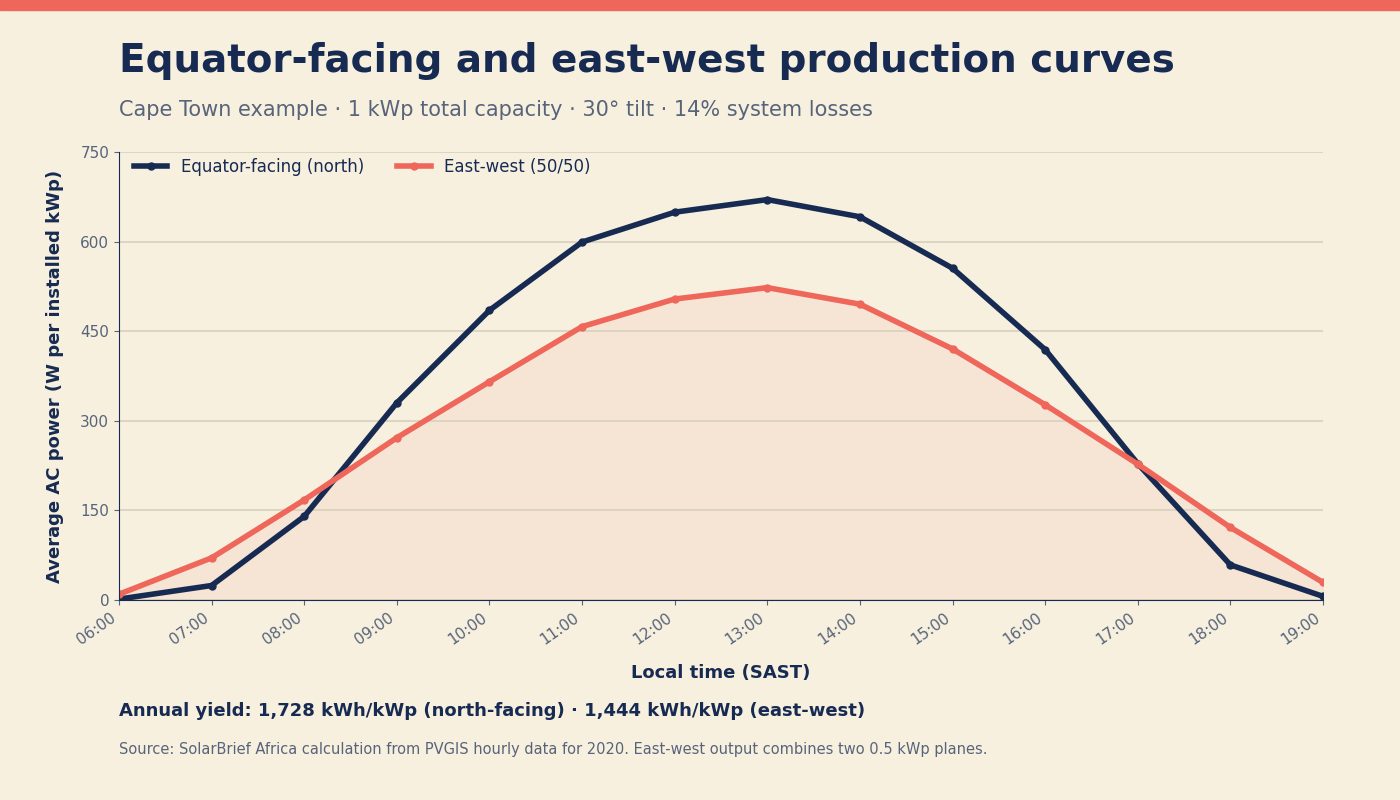
Closely packed east-west rows raise installed kWp per square metre where roof geometry permits. A broad production profile suits businesses consuming power beyond midday. Inverter loading and grid-export limits influence the financial result. PVGIS covers energy yield; a roof layout determines packing density. NREL research confirms the timing effect for east-, south- and west-facing arrays.
Rooftops, Trackers And Mobile Installations
On a pitched roof, the building sets array geometry. Roof slope becomes module tilt, while the roof face fixes azimuth unless a support frame is added. Parapets and trees narrow usable area by casting shade.
With flat-roof solar, designers choose the angles. Row spacing then limits shading while preserving maintenance access. Supports resist wind uplift and roof loading. Where roof geometry or afternoon demand conflicts with the annual optimum, a manual azimuth produces a suitable design.
Ground arrays avoid roof constraints, making solar trackers possible. Trackers rotate modules during the day to reduce the angle between direct sunlight and the array surface. Drive equipment and moving joints increase maintenance and affect row spacing. Sandia distinguishes fixed and tracked arrays.
For temporary or mobile arrays, quick assembly and transport guide the mounting choice. Their supports still require stability under wind. A qualified engineer should confirm structural loads and electrical protection. The review should cover safe maintenance access before construction.
What “Optimal” Means In The Project Builder
The Project Builder separates orientation into tilt, azimuth and mounting controls.
| Control | Function |
|---|---|
| Tilt angle | Sets the module slope from 0° to 60° |
| Face the equator | Selects south above the equator and north below it |
| Azimuth compass | Applies a manual direction using the PVGIS convention |
| Mono-directional | Places all rows at one azimuth |
| Bi-directional | Splits capacity between east- and west-facing planes |
After the project point is placed, PVGIS calculates the yield for the selected tilt, azimuth and mounting arrangement. The output compares this design with Maximum achievable, a reference based on PVGIS optimal tilt and an equator-facing array.
“Optimal” is therefore an output benchmark, not a button or mounting mode. It identifies the highest modelled annual yield under the selected location and loss assumptions. The difference between this reference and the project yield indicates the energy cost of the chosen geometry.
Testing several configurations reveals which layout best fits the roof, available land and hours of electricity demand.
Compare The Orientation Options
Place your project point on the SolarBrief map. Compare Optimale, Vers l’équateur, Est-Ouest and Manuel using your site coordinates and project settings. Review the annual yield and production profile from each configuration, then choose the mounting arrangement suited to the available space and the site’s electricity demand.
FAQ
Sites north of the equator usually point their modules south. Sites in the Southern Hemisphere point them north. Near-equatorial projects need a coordinate-based PVGIS calculation because the sun crosses north and south of the site during different seasons.
Latitude sets an initial angle for a fixed array. The final tilt depends on local cloud patterns and horizon shading. Seasonal electricity demand also affects the choice, while roof geometry may restrict the available angle. PVGIS tests the selected coordinate using long-term solar data.
Its annual yield per installed kWp usually falls below an optimally tilted equator-facing array. However, east-west rows fit more capacity on some roofs and spread production from morning to afternoon. This profile may align better with commercial electricity demand.
A low tilt suits near-equatorial sunlight, but a completely flat module drains poorly and collects dirt. Around 10° supports rainwater runoff, although local dust and maintenance plans influence the final angle.
It is the PVGIS reference yield for an equator-facing array at the modelled optimal tilt. Compare it with the project yield to measure the energy difference caused by the selected tilt, azimuth and mounting arrangement.
Glossary: Key Terms
A quick recap of the technical terms in this article, listed in their order of appearance.
| Term | Meaning | Formula or convention |
|---|---|---|
| Installed capacity (kWp) | Rated direct-current power of the PV array under Standard Test Conditions. | kWp = Number of modules × Module rating (Wp) ÷ 1,000 |
| Tilt | Angle between the module surface and horizontal. A 0° module lies flat. | Tilt = 0° to 90° |
| Azimuth | Compass direction faced by the module. | PVGIS: South 0° · East −90° · West +90° · North ±180° |
| Plane-of-array irradiation | Solar energy reaching the tilted module surface over a stated period. | Starting tilt ≈ Absolute latitude |
| Latitude rule | Starting tilt based on distance north or south of the equator. | Starting tilt ≈ Absolute latitude |
| Optimal tilt | Fixed angle linked to the highest modelled annual energy yield at a coordinate. | PVGIS tests several tilt angles and selects the highest annual result. |
| Self-cleaning angle | Minimum slope retained to support water drainage and dirt removal. | About 10°, subject to rainfall, dust and maintenance conditions. |
| Equator-facing | South-facing above the equator and north-facing below it. | Northern Hemisphere: South · Southern Hemisphere: North |
| East-west layout | Equal array sections facing east and west to spread production through the day. | East-west yield = 50% east yield + 50% west yield |
| Specific yield | Annual AC energy produced per installed kWp | Specific yield = Annual AC energy ÷ Installed DC capacity |
| Production profile | Variation in power output from morning to evening. | Expressed as power versus time, P(t) |
| Packing density | Installed PV capacity within the available roof or land area. | Packing density = Installed kWp ÷ Usable area (m²) |
| Inverter loading ratio | Relationship between array DC capacity and inverter AC rating. | ILR = DC capacity (kWp) ÷ Inverter capacity (kWac) |
| Grid-export limit | Maximum PV power permitted to flow from the site to the grid. | Set by the utility or connection agreement. |
| Solar tracker | Mounting system rotating modules as the sun crosses the sky. | Orientation varies with time. |
| Mono-directional mounting | All rows face one azimuth at the selected tilt. | One tilt and one azimuth for the full array. |
| Bi-directional mounting | The Project Builder divides capacity between opposite east- and west-facing planes. | 50% east + 50% west |
| Maximum achievable | PVGIS reference yield from optimal tilt and equator-facing orientation. | Highest modelled annual yield for the selected location and losses. |
| Net project yield | Modelled annual yield from the chosen tilt, azimuth and mounting setup. | Annual AC energy ÷ Installed capacity (kWp) |
What it means
Tilt sets module slope, while azimuth sets compass direction. Equator-facing arrays tend to maximise annual yield; east-west layouts spread output between morning and afternoon. Project Builder calculates how the selected geometry affects production at the chosen site.
Sources: PVGIS 5 User Manual, PVGIS API documentation, Sandia PVPMC: Fixed Tilt, Sandia PVPMC: Angle of Incidence, Sandia PVPMC: Single-Axis Tracking, Sandia PVPMC: Soiling Losses, NREL SAM Photovoltaic Model Technical Reference