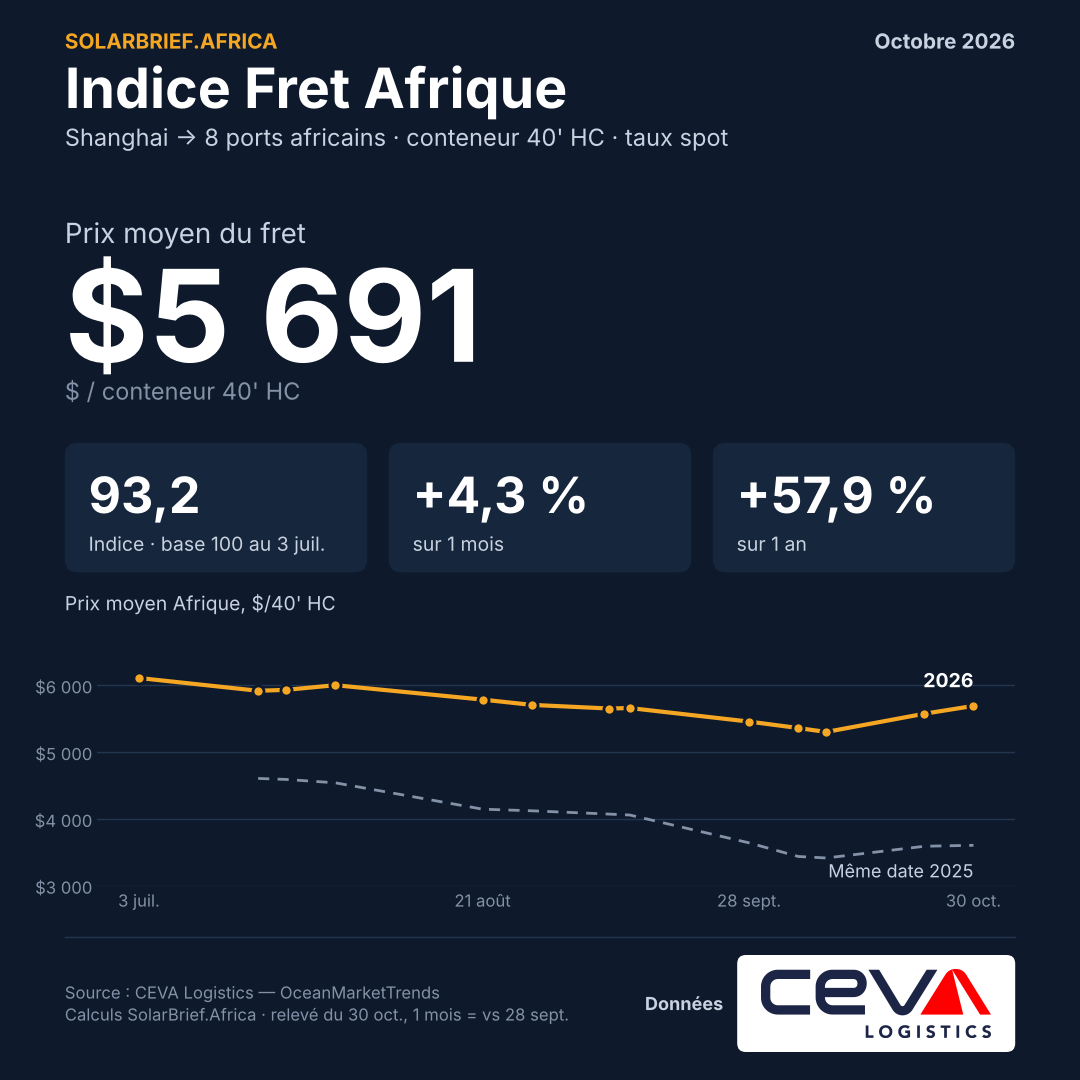
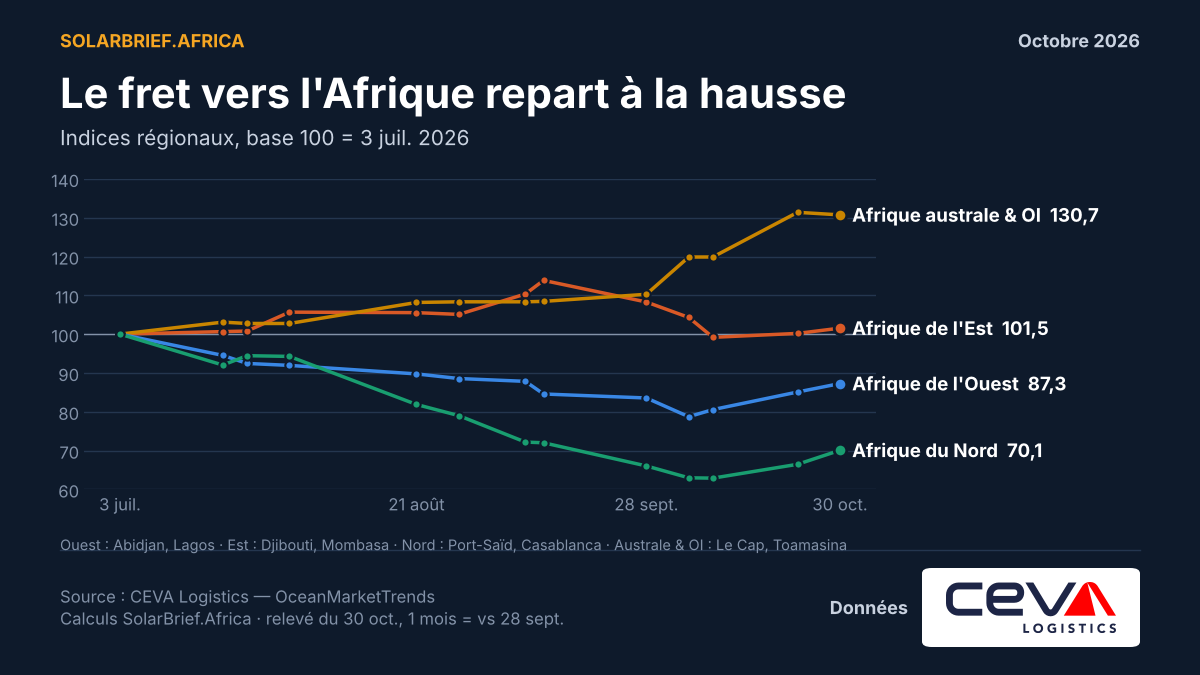
As at 30 October 2026, compared with the end of September:
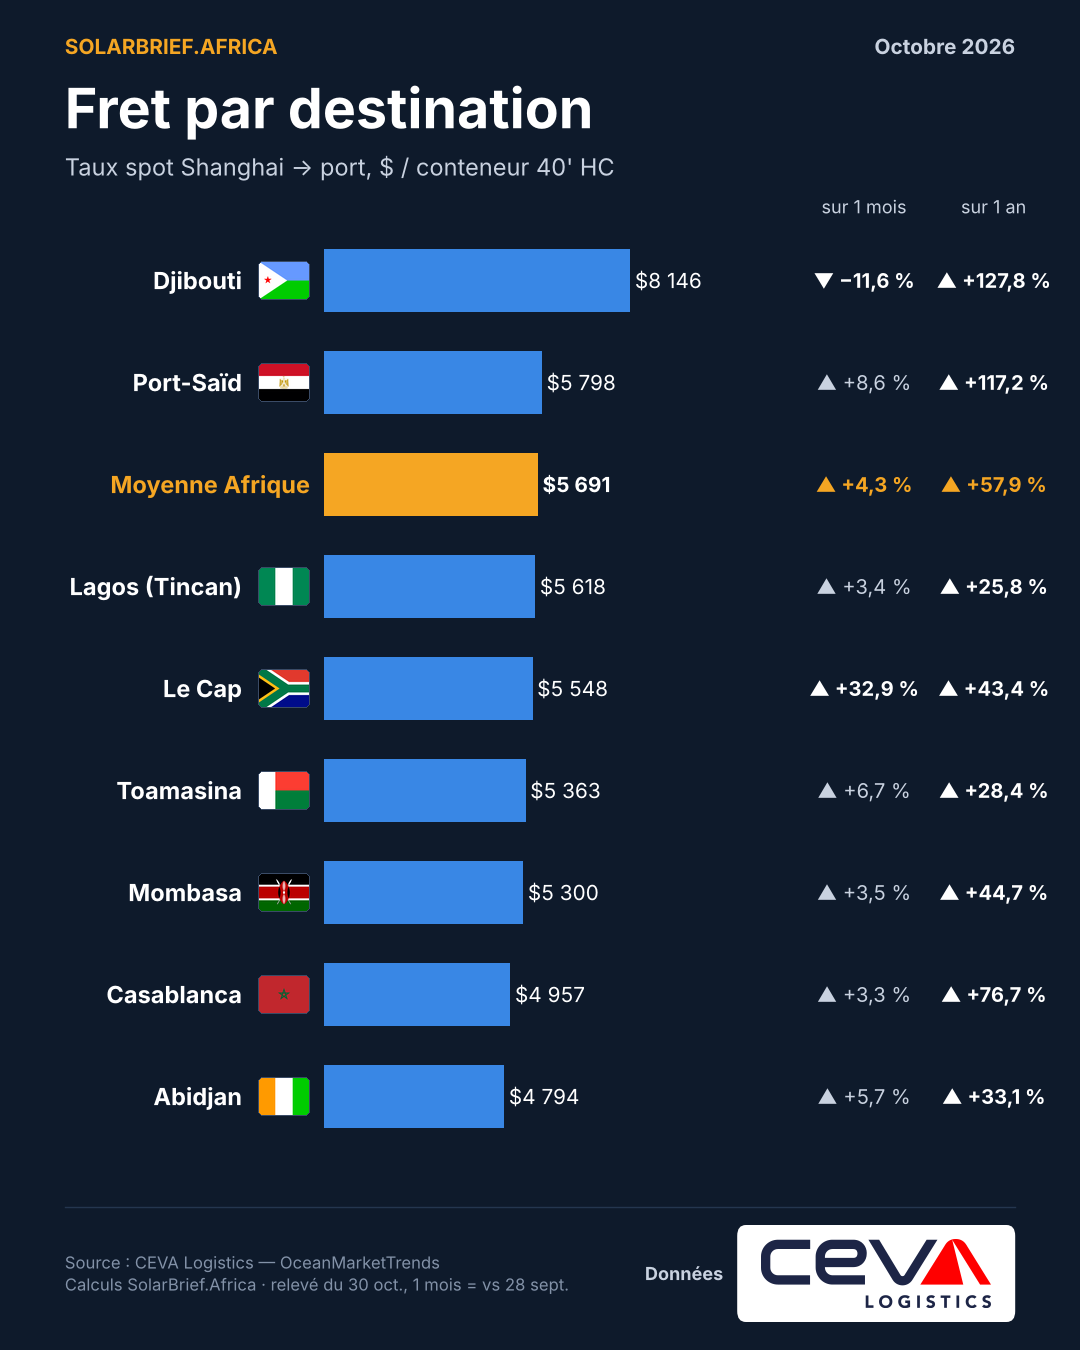
$5,691 per container on average, up 4.3 per cent month-on-month – the first monthly increase since records began. The low was reached on 9 October ($5,300): the price has rebounded by 7.4 per cent in three weeks. Based on the monthly average ($5,481), October remains down by 1.9 per cent. Year-on-year, the increase stands at 57.9 per cent.
Cape Town soars: up 32.9 per cent to $5,548. Along with Toamasina (+6.7%), Southern Africa and the Indian Ocean now boast the highest regional sub-index (130.7, up 18.5% over the month).
A near-universal rise: Port Said +8.6 per cent, Abidjan +5.7 per cent, Mombasa +3.5 per cent, Lagos +3.4 per cent, Casablanca +3.3 per cent. North Africa (+6.1 per cent) and West Africa (+4.5 per cent) have been recovering from their lows.
Djibouti was the only port to see a fall: −11.6 per cent to $8,146. The port remains the most expensive in the basket (+128 per cent year-on-year). Abidjan has become the cheapest destination ($4,794).